What is Kinematics & Compliance Analysis?
Fundamentals
A Kinematics and Compliance (K&C) test is a deep dive into the “DNA” of a vehicle’s suspension by measuring the complete system response to realistic tire loads. Even though a wheel hub appears well constrained, under load it will deflect in all 6 degrees of freedom (DOF). Some deflections are large while others may be very small but still significant.
Kinematics – the movement of a vehicle’s wheels through articulation, determined by the geometry of the suspension pivots.
Compliance – the deflection of a vehicle’s wheels under load, determined by the stiffness of metallic and elastomeric components.
What is a K&C rig? What does it do and how does it do it?
A K&C rig is a specialized device that can precisely measure a vehicle’s suspension movements and quantify an extensive number of parameters.
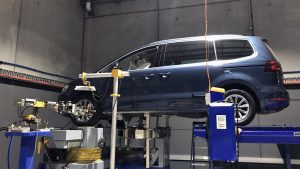
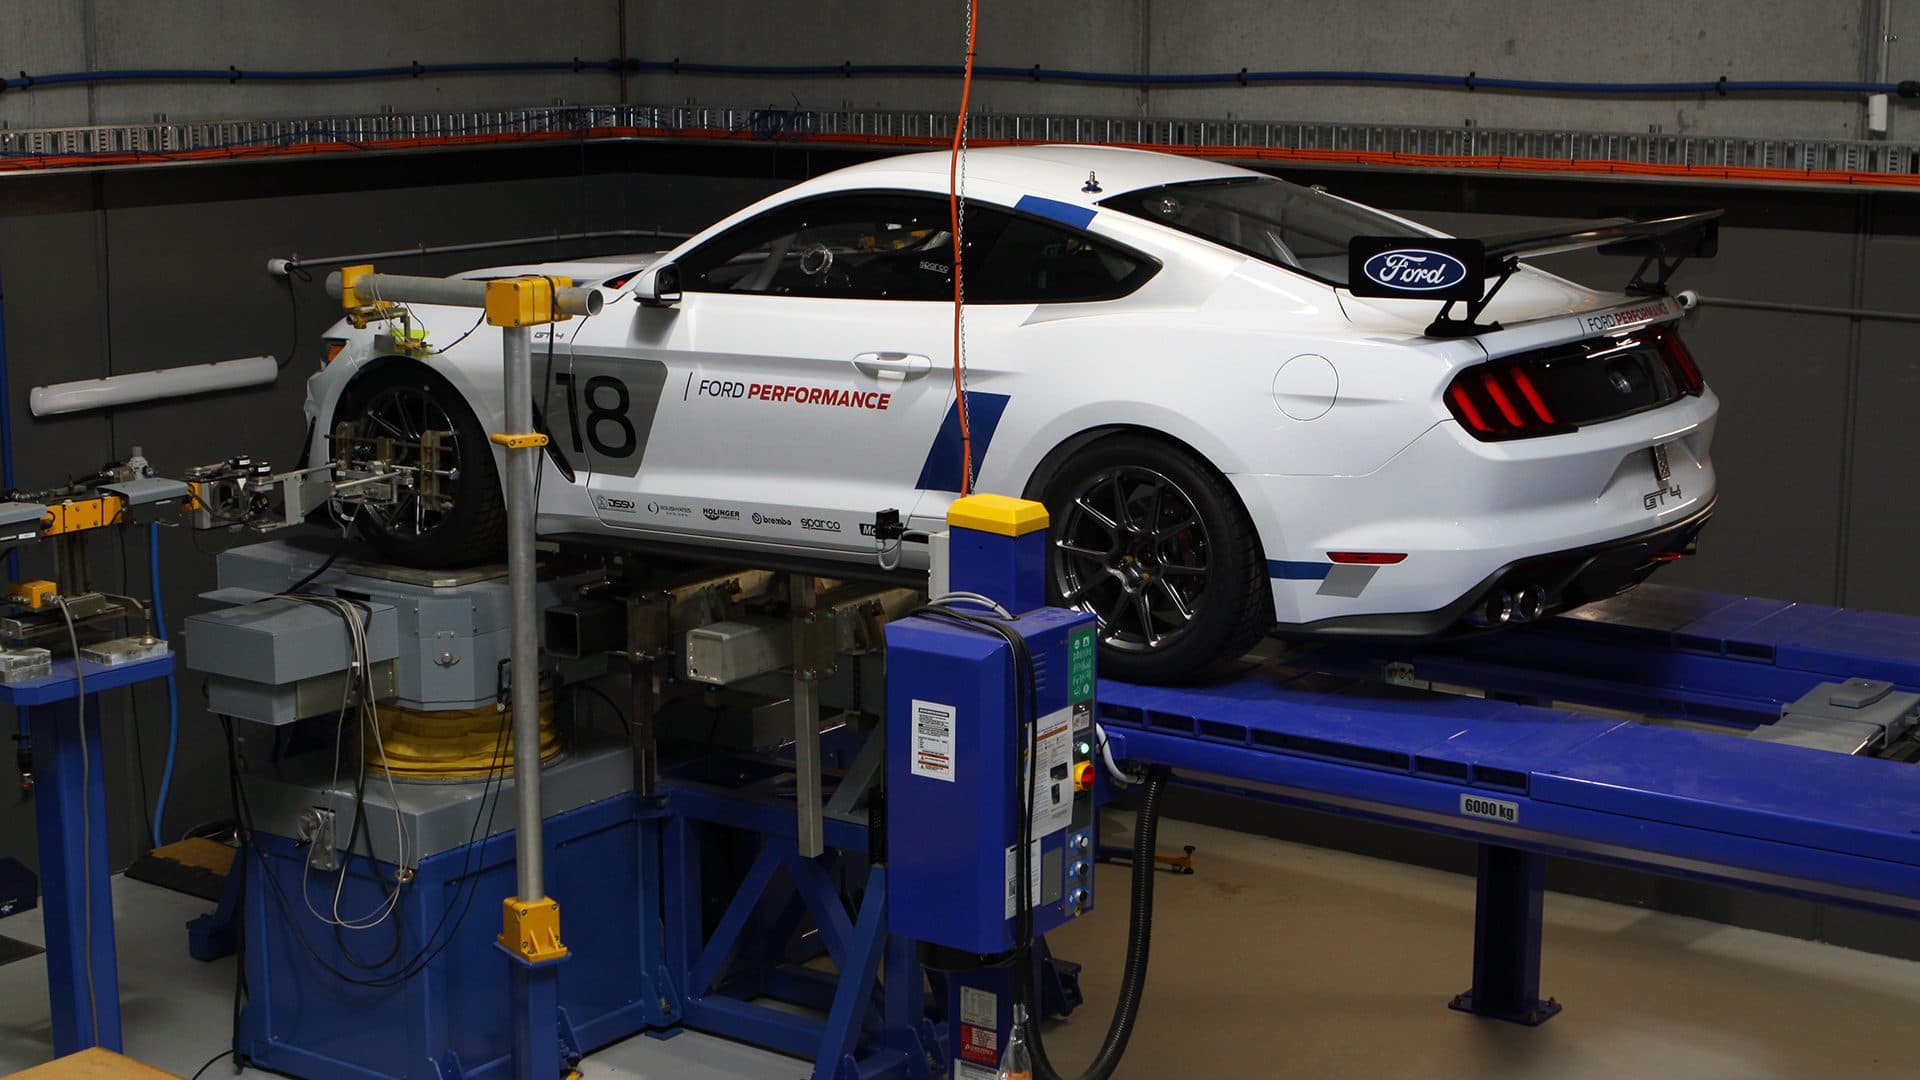
A K&C rig must hold the vehicle structure in such a way that realistic road loads can be applied to the tire contact patches. The tires sit on high-grip platforms to simulate the road, and the vehicle body is held rigidly on either a movable or static platform.
This enables road loads to be applied vertically, laterally, longitudinally, and through torque. Loads are applied in a “quasi-static” manner (very slowly) because transient effects such as damping forces will corrupt the results. Typically a slow triangular waveform is used at 40 – 60 seconds per cycle. Loads and amplitudes must be commensurate to the vehicle so as not to exceed grip limit.
Data collection involves applying a controlled and measured input to the tire and measuring the response in the 6 DOF hub movement and deflections.
Inputs
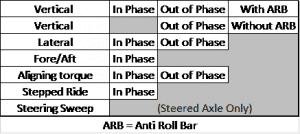
The inputs are applied in-phase (same direction) and/or out-of-phase (opposite direction) in separate tests. A steering sweep can also be run.
Typical measurements are:
Outputs
Many characteristics are highly non-linear, so output is graphical and shows the wheels’ curves separately. There is also a linearized calculation of the through-centre gradient. Hysteresis/friction effects will display clearly by the severity of the hysteresis loop.
Output can be used to:
- Compare the vehicle to a virtual model
- Check build accuracy/symmetry
- Observe true behaviour, where model fidelity is lacking (elastomeric components)
- Problem solve, where an elusive issue exists
- Iteratively tune – i.e., change components and re-measure
- Chart variables such as adjustable anti-roll bars (ARBs) or adjustable hard-points in a race car
- Generate suspension plots to directly populate a VI-Grade Car Real Time vehicle model for off-line simulations or use in driving simulators
Typically, the X-axis of graphs will be the input deflection or force and the Y-axis will be any of the 6 DOFs of the hub. Some of these plots are of much more interest than others based on the hierarchy of influence on vehicle dynamics. A K&C report will typically include hundreds of plots.
Measurements
Vertical
- Articulates the suspension vertically from the static position. In-phase will show vertical rates and many kinematic characteristics such as steer, castor and camber changes, wheel centre and contact patch deflections, roll centre and side view swing-arm characteristics. For road cars, amplitude will typically be +/-100mm, race cars +/-50mm. Out-of-phase will show the influence of the ARB.
Lateral
- Simulates cornering force. For road cars this will typically be +/-4000N per tire (~0.8G), and can be higher for cars with aero downforce. In-phase will show parameters such as lateral force steer, camber and castor compliance, and lateral/vertical load coupling. Out-of-phase excludes steering system mounting compliances, hence the influence of the mounting system can be comprehended.
Longitudinal
- Simulates braking force. Typically the same loads will be used as for lateral. This measurement will show parameters such as brake force steer, camber and castor compliance, and longitudinal/vertical load coupling.
Aligning torque
- Applies a torque through the contact patches and will show various aligning torque compliances.
Steering Sweep
- Articulates the steering wheel across ~+/-360°. Shows parameters such as overall steer ratio, ratio variation, Ackermann curves and % correction as well as camber/castor with steer.
The measurements listed above are typical for a K&C rig however many other conditions can be measured.
Please feel free to contact Multimatic with further questions.
Contacts:
Leena Gade (UK)
lgade@multimatic.com
+44 1842 755744
Michael Barber (Australia)
mbarber@multimatic.com
+61 3 8709 9900